FRAP-Tool
The frap tool allows to export the intensity measurements of the brightest cube in a selected region in a series of 3d images from a FRAP experiment. Multiple selections for the region of interest are possible within one experiment.

The tool is part of the MRI Cell Image Analyzer. Please follow the instructions here to install it. An example image-series can be found here. In order to use the example image series, you must unzip the archive file into a folder and point the FRAP-tool to that folder.

After the installation of the MRI Cell image analyzer, open the "MRI FRAP Tool" toolset from ImageJ's toolset button (>>). Press the first button of the toolset to open the FRAP-tool.
Measure the brightest cube in a region in a series of stacks
In FRAP experiments a spot of a fluorescently stained cell is hit by a laser in a way that the
fluorescence is destroyed. The fluorescent molecule will then come back and this is the interesting
information that has to be measured. The data the user wants to extract is the intensity in the spot in
a time series of 3d images, as the fluorescence comes back into the spot.
In order to measure the brightest spot the user indicates a region in which the spot is searched. This
minimizes the risk of errors. The region is defined on a stack build from the z-projections of the
stacks of each timepoint. As a new requirement multiple selections per cell must be possible. This
can be useful when the cell moves because there is a risk that other bright spots might enter the
fixed selection while the FRAP-spot might leave it.
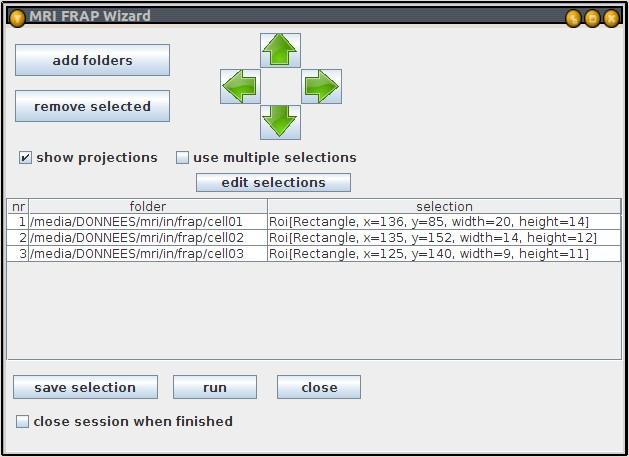
The user can add multiple cells, define the slections for all cells and run the processing in batch
mode. The results are a spreadsheet file with the coordinates of the brightest cube in the region, the
integrated intensity and the mean intensity. Furthermore a control images (stacks) with the brightest
cubes that have been used are saved in a folder.
Adding cells
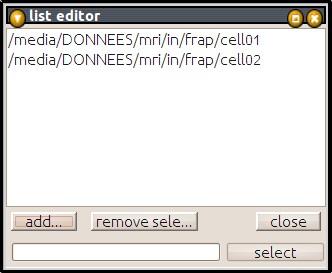
The user can add cells by using the add folders button. This will open the list editor. The add button
of the list editor allows to add one or multiple folders in a time. When the list is setup, it will be
transferred to the FRAP-wizard when the list editor is closed.

Each folder representing a FRAP experiment must contain a series of image-stacks in tif or stk
format. The image names must end with the number of the image in the time series. The numerical
order is taken into account.
Removing cells
By clicking on the remove selected button, users can remove folders from the list of folder to be
process.
Creating projections
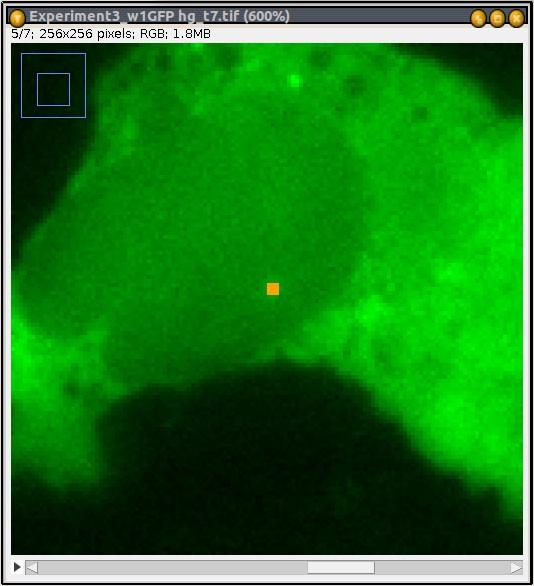
Clicking on an entry of the list opens by default a stack created from projections of the different
time-points. If the folder contains a sub-folder named projections, these projection are used
otherwise the projections are created (time consuming).
The projections in the folder projections must have the same names as the stacks from which they
have been created.
Display of stacks or projections
By clicking on a list entry, the corresponding image is shown. It is possible to navigate through the
time dimension using the image scroll bar.
Vertical arrows allows the navigate between different cells (or folders).
If the checkbox show projection is not selected, the separate stasks of the cell are shown instead of
the series of projections. In the case, horizontal arrows allow to navigate between the time-points.
Creating and editing selections
A selection can be created on the image and can be saved by clicking on the save selection button.
A checkbox allow multiple selections, changes the behaviour of the interface by using the ROI
manager to handle multiple selection in time. A button edit selections opens the selections in the roi-
manager. The save selections button will save the selections currently in the roi manager and update
the display of the selections in the list. The different selections act as key images. A selection is
valid until another is encountered. A selection is needed on the first image.
Running the batch processing and results
When the run button is pressed the cells are processed one after the other. The selection or the list of
selections associated with the cell is taken into account. The application executed for each cell is the
one that can be opened under _applications/stacks/measure best cube batch auto_3pix.cia. The size
of the cube that is actually used for measurements is configured in this application. See the next section
for details on how to change the size of the cube.
The result is a spreadsheet file of the following form:

A control stack-image for each time-point stack, containing the cube used in red, is saved into the
folder cubes:

Changing the size of the cube

To change the size of the cube in which the intensity is measured, select the "Montpellier RIO Imaging" toolset from ImageJ's toolset button (>>).
Press the "visual scripting" button on the toolset (the button number 4). This will open the "MRI Visual Scripting" launcher window.

Open the application "measure best cube batch auto_3pix" from the menu Applications>applications>stacks>measure best cube batch auto_3pix.

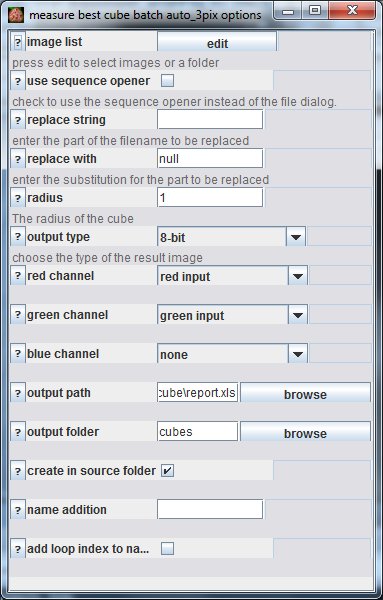
Press the "o"-button on the application's tile window. This opens the options dialog of the application.

Change the size of the cube in the field radius. A radius 1 means a cube of 3x3x3 voxels. Close the options dialog and right on the tile-window of the application. Select save from the context menu.
Delimitations
- the tool only exports the intensity data. It does not fit a curve or extract parameters from it