MRI Root Shapes Tool
The Root Shapes Tool helps to analyze the shapes of roots. It takes images of roots as input and allows to- segment the roots
- calculate a plot of the sum of distances to the center of root pixels in each line per depth
- create a plot of the ratio of two such plots
License: CeCILL-C
Caveat
The tool is experimental. Technically it should work as described, however it is by no means clear, for the time being, that the results have a meaningful interpretation.
Getting started
Drag the link MRI_Root_Shapes_Tool.ijm to the ImageJ launcher window, save it under macros/toolsets in the ImageJ installation and restart ImageJ.
Select the "MRI_Root_Shapes_Tool" toolset from the >> button of the ImageJ launcher.
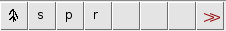
- the first button (the one with the image) opens this help page
- the s button crops the image to the current selection and segments the root
- the p button works on the binary image of the root and plots the sum of the distances per depths
- the r button creates a plot of the ratio of the two last sum-of-distances plots
Options
Right-click the s-button to open the options dialog.

- thresholding method - the auto-thresholding method used to binarize the image
- min. size - during the segmentation objects smaller then min. size will not be taken into account
- undefined value (div by 0) - value substituted when the ratio is undefined. The default value is NaN (not a number). It is not displayed. If you use another value and want to switch back to NaN you can type NaN in the field.
- display center - this option allows to display the center points for each line.
Description
Segmentation
Make a rectangular selection around the root. The tool will crop the image to the selection and convert it to 16 bit. It will than apply the auto-threshold to binarize the image and remove noise using the particle analyzer with the provided min. size. The tool expects the root to have high intensity values and the background low values.
 |
 |
Plot distances
This operation works on the binary image. It first detects the lowest and highest pixel belonging to the root and draws a line at these positions to an overlay of the image. Then it scans the image from top to bottom and calculates for each line:
- the center of mass of the root-pixels in that line
- the sum of the distances of all root-pixels in that line to the center of mass of the line
It displays the plot of the sums of distance per depth from top to bottom. When the option is selected, the center point are marked in an overlay of the image.
 |
 |
 |
 |
Calculate ratio
This command calculates a plot of the ratios of the two preceding sum-of-distances plots. When the value of the second plot is zero the ratio is undefined and the value provided in the options is used. The default replacement value is NaN (not a number). Two versions of the ratio-plot will be shown, a version with a log-scale for the y-values and a normal version.
 |
 |