Colony Blob Count Tool
The Colony Blob Count Tool helps to count colonies and measure the areas of the colonies. The bacteria colonies are supposed to appear as blobs on the image (in contrast to cases where they appear as small spots, see this macro for the second case). An example image can be found here.
Getting Started
To install the tools, drag the link Colony_Blob_Count_Tool.txt to the ImageJ launcher window, save it under macros/toolsets in the ImageJ installation and restart ImageJ.
Select the "Colony_Blob_Count_Tool" toolset from the >> button of the ImageJ launcher.

- the first button opens this help-page.
- the s button selects the colonies in the image
- the c button counts and measures the selected colonies
- the last button saves a control image with the outlines of the selected colonies in an overlay
Selecting Colonies
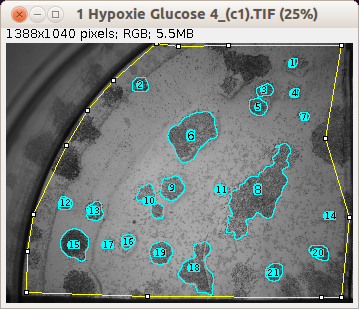
If the image has a selection, only the selected region is taken into account. Note that you can save an image with a selection in the tif-format with ImageJ. The colony-blobs should be dark on a light background. Otherwise you have to inverse the contrast of the image. For each detected blob a roi is added to the roi-manager.
Options
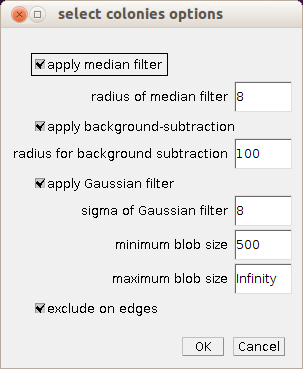
Right-click on the s-button to open the options dialog of the tool.

- apply median filter: if checked a median filter is applied to the image before the processing is done to smooth the blobs and remove small background objects
- radius of median filter: the bigger the radius the more the image will be smoothed
- apply background subtraction: if checked a background subtraction is executed. The background needs to be bright.
- radius for background subtraction: the radius for the rolling ball algorithm. It should be at least as large as the radius of the biggest object in the image.
- apply Gaussian filter: if checked a Gaussian filter is applied after the background subtraction, to smooth the image and to remove remaining structures within the blobs.
- sigma of Gaussian filter: the bigger the value of sigma the more the image will be smoothed
- minimum blob size: the area of the smallest objects that are taken into account
- maximum blob size: the area of the biggest objects that are taken into account
- exclude on edges: if checked objects touching the edge of the image or selection are excluded in order to measure correct areas
Counting selected colonies
After you ran "select colonies" press the c-button to count the selected colonies and measure the areas. The counting and measurement is applied to all objects in the roi-manager. You can make corrections before running the count. A table with the name colony count that contains the directory and the name of the current image, the number of colonies, the mean area, the standard deviation of the area distribution, the minimum area and the maximum area.
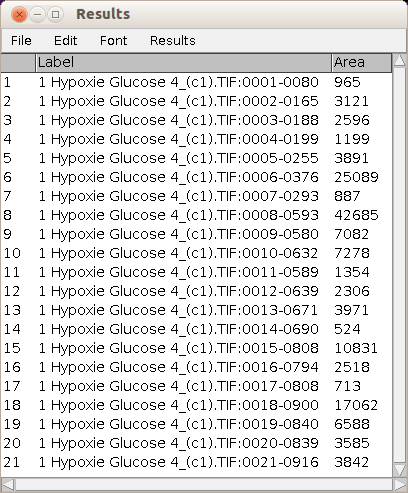
The area measurement for each object is displayed in the standard ImageJ results table.
Saving control images
Press the last button to save a control image containing the selection and the objects that have been measured. The image is saved into a sub-folder of the folder containing the image, with the name colonies-control-images. The selection and the objects are drawn into the image so that they are visible in the thumbnail and the image viewer of the operating system. The image contains the selection as a roi and the objects as an overlay. When the image is opened with ImageJ the objects can be recreated with the command "Image>Overlay>To ROI Manager".
Results


Publications using the tool
- Ishiuchi, T., Ohishi, H., Sato, T., Kamimura, S., Yorino, M., Abe, S., Suzuki, A., Wakayama, T., Suyama, M., and Sasaki, H. (2019). Zfp281 Shapes the Transcriptome of Trophoblast Stem Cells and Is Essential for Placental Development. Cell Reports 27, 1742-1754.e6.
- - A. M. Danev, R. N. Gabrova, T. Yaneva-Marinova, and A. I. Angelov (2018). Application possibilities of open-source software for microbiological analyses. Bulgarian Chemical Communications V. 50, Special Issue G, 239–245.
- - Berliocchi, L., Chiappini, C., Adornetto, A., Gentile, D., Cerri, S., Russo, R., Bagetta, G., and Corasaniti, M.T. (2018). Early LC3 lipidation induced by D-limonene does not rely on mTOR inhibition, ERK activation and ROS production and it is associated with reduced clonogenic capacity of SH-SY5Y neuroblastoma cells. Phytomedicine 40, 98–105. https://doi.org/10.1016/j.phymed.2018.01.005.
- - Verhoeven, J., Lambrecht, A., Verbrugghe, P., Herijgers, P., and Fourneau, I. (2017). Remnant Epitope Autoimmunity in Human Abdominal Aortic Aneurysm: A Pilot Study with Elastin Peptides. Annals of Vascular Surgery 44, 408–413. https://doi.org/10.1016/j.avsg.2017.05.036.
- - MARY E. COLE, and SAMUEL D. STOUT, Poster: Three-dimensional Reconstruction of Vascular Pore Networks in the Human Rib from Two-dimensional Serial Sections, Ohio State University. 2017
- - Hunter, R.L., and Agnew, A.M. (2016). Intraskeletal variation in human cortical osteocyte lacunar density: Implications for bone quality assessment. Bone Reports 5, 252–261.
- - Goliwas, K.F., Marshall, L.E., Ransaw, E.L., Berry, J.L., and Frost, A.R. (2016). A recapitulative three-dimensional model of breast carcinoma requires perfusion for multi-week growth. Journal of Tissue Engineering 7.
- - Hunter, R.L. (2015). Variation in Cortical Osteocyte Lacunar Density and Distribution: Implications for Bone Quality Assessment). Dissertation. Ohio State University.
- - Pfister, N.T., Fomin, V., Regunath, K., Zhou, J.Y., Zhou, W., Silwal-Pandit, L., Freed-Pastor, W.A., Laptenko, O., Neo, S.P., Bargonetti, J., et al. (2015). Mutant p53 cooperates with the SWI/SNF chromatin remodeling complex to regulate VEGFR2 in breast cancer cells. Genes & Development 29, 1298–1315.
- - Mary Elizabeth Cole. A Semi-Automatic Method for Intracortical Porosity Quantification With Application to Intraskeletal Variability. Ohio State University. 2014