MRI Retina Tool
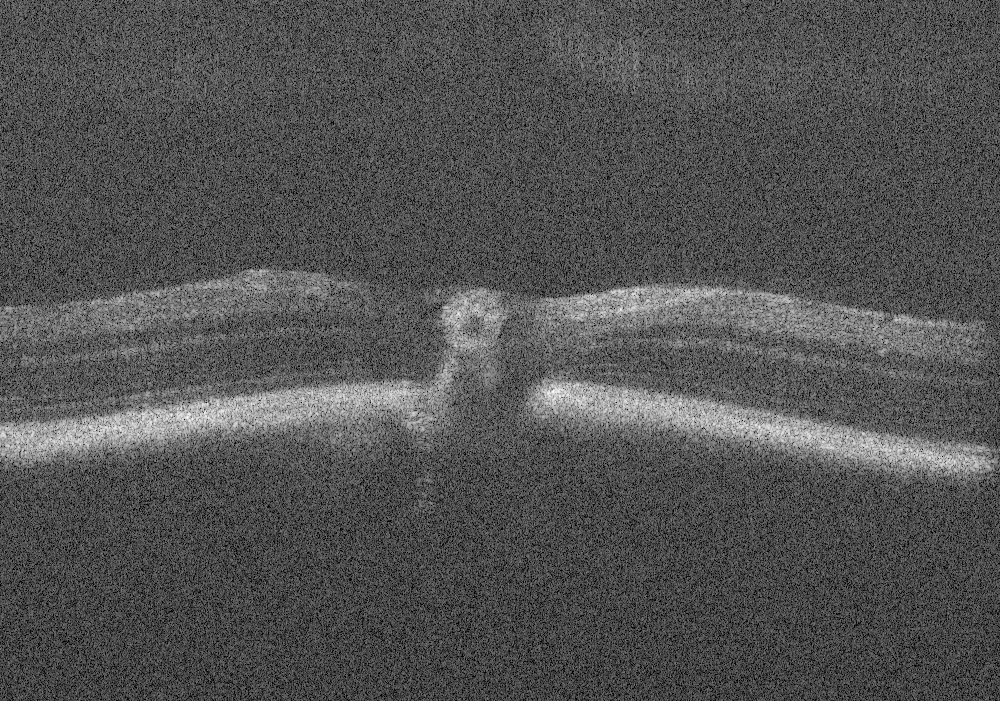
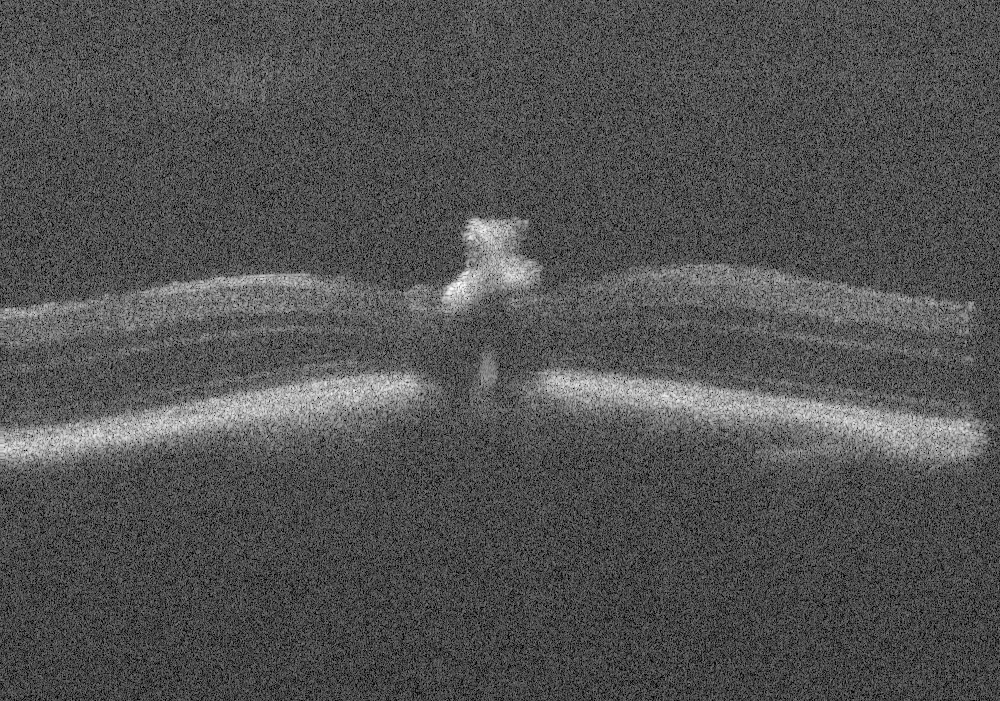
Measure the area or thickness of a structure in retinal scan images from Optical coherence tomography (OCT). The image is always centered. It has a width of 1000 pixel and 1.4mm. There are two structures of interest one in the right half of the image and one in the left. The max x position of the right structure of interest is at 0.35mm. The length of the structure is 0.2mm. You can find test images here and here.
Getting started
To install the tool, drag the link MRI_Retina_Tool.ijm to the ImageJ launcher window, save it under macros/toolsets in the ImageJ installation and restart ImageJ.
Select the "MRI_Retina_Tool" toolset from the >> button of the ImageJ launcher.

- The m-button measures the active image
- The b-button runs a batch job for measuring all images in a folder
- The e-button adds the detected regions to the roi-manager so that can be edited manually
- The r-button re-measures the regions in the roi-manager
Options
Right-click on the m-button to access the options of the measurement tool.

- image width - the width of the whole image in mm.
- width of region of interest - the width of the region that will be detected in mm.
- x of region of interest - the x-coordinate from the middle of the region that will be measured in mm.
- nr. of measurement points - the number of points at which the borders will be detected and the length be measured
- line width - the line width of the line from which the profile is created, the bigger the value the more the plot is smoothed
- min. height over background - the peak in the plot corresponding to the first border must be at n times the stdDev above the background
- window width for local max. [pixel] - when detecting the local maximum no higher maximum must be within the window
- min. depth below max - the local minimum corresponding to the second border must be the given number of times the stdDev below the max.
- title of measurements table - the title of the table that will contain the measurements of the tool
- debug - when selected the plots used to detect the edges are displayed and a cross marks the points detected in each plot
Right-click on the b-button to access the options of the batch-processing.

- file extension - the file extension of the input images
- name of the output folder - the name of the folder into which control images will be written
Method
At each given x-positions a vertical line with the given width is drawn across the whole image and a profile plot created. The first maximum n-times the stdDev above the background level is detected. A minimum to the right of this maximum that is at least m-times the stdDev below the maximum is detected. A horizontal line from this point to the left is drawn an the point where is crosses the plot found. The length of this line segment is considered the length of the region of interest.
Hints
- You can use the Pad Image Names tool to make sure that images will be opened and measured in the right order
- You can use the Modify Polygon Selection tool to manually correct the y-positions of selection vertices without modifying their x-positions
Results


Publications
- Jagodzinska, J., Sarzi, E., Cavalier, M., Seveno, M., Baecker, V., Hamel, C., Péquignot, M., and Delettre, C. (2017). Optical Coherence Tomography: Imaging Mouse Retinal Ganglion Cells In Vivo. Journal of Visualized Experiments.