Optodes pH Analysis Tools
These tools have been developed to study the functioning of roots with the help of sensors called pH optodes that allow to measure the protons in the earth. The optodes come in the form of a paper containing a polymer matrix to which pH sensible fluorophores are fixed. When the optodes are in touch with the soil the protons will modify the capacity of the fluorophores to emit light. In this way the pH distribution created by the functioning of the root can be visualized. The fluorophores are excited by a camera equipped with LEDs and images are taken.
The tools allow to calculate the pH values from the optodes images. They allow then to calculate a graph of the pH depending on the distance from the root.
You can find an example image here: ME_ST_XX_00023.png.
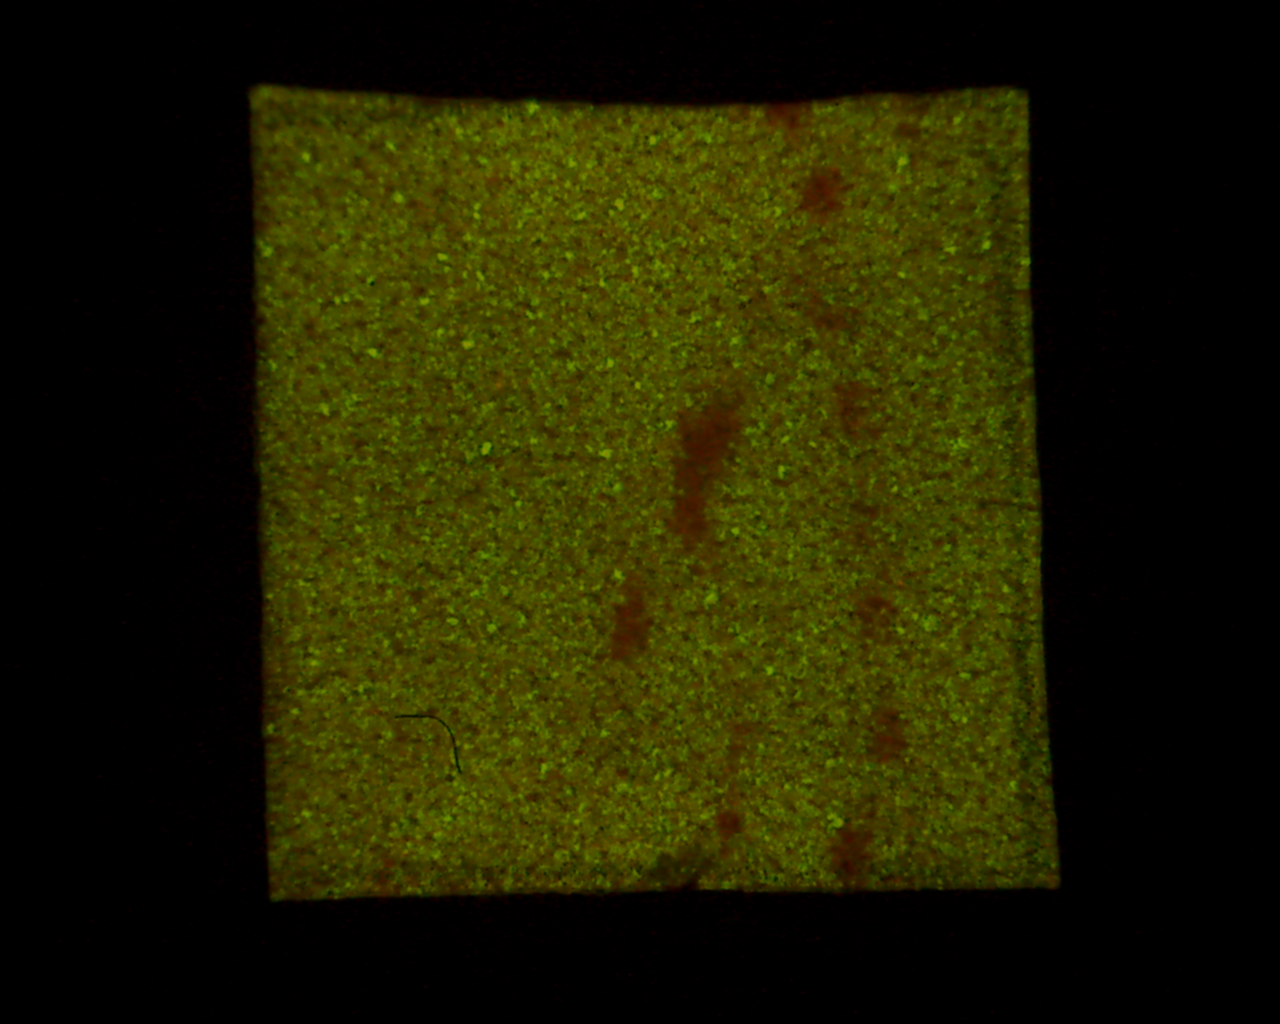
Getting started
To install the tools, drag the link Optodes pH Tools to the ImageJ launcher window, save it under macros/toolsets in the ImageJ installation. Download the lookup-table pH.lut and save it into the luts folder of ImageJ. Call "Refresh Menus" from the help-menu of ImageJ or restart ImageJ.
You may also want to install the Align Objects Tool to align the optrodes image taken from the paper and the photo of the corresponding zone of the soil.
Select the "Optodes pH Tools" toolset from the >> button of the ImageJ launcher. After that you can add the single tool "Align Objects Tool" from the lower part of the >> menu.

- the first button (the one with the image) opens this help page
- the pH-button calculates the pH values from the images of the optrodes.
- the plot-button creates a graph of the pH values depending on the distance from the root.
- see Align_Objects for the last button
Options
Right-click on the pH-button to open the options dialog:

- a, b, c, d: The pH values are calculated in the following way. First the red channel is divided by the green channel. Then the following formula is applied to each pixel value p in the resulting image:
pH = a + (b * log(((c-d)/(p-d))-1))
- max pH: Values bigger than max-pH will be set to max-pH.
- keep ratio image: - When selected the image resulting from the division of the red image by the green image is kept.
- apply LUT: - When selected the pH.lut lookup-table is applied to the resulting image.
Right-click on the plot pH-button to open the options dialog:

- default line width: The line-width used to create an area-selection when the user provides a line selection of width one.
Method
Creation of the pH-image
The two channels are converted into 32-bit images and the red channel is divided by the green channel. The formula
pH = a + (b * log(((c-d)/(p-d))-1))is applied to each pixel of the resulting image.
Creation of the pH-plot
Make a selection of the structure (for example the root) from which the distances will be measured. You can use area selection tools or line selections tools. If the line width is one the default line width will be used instead. You can either put the selection as the first roi in the roi-manager or put it onto the pH-image. Then select the pH-image and press the pH-plot button. A binary mask will be created from the selection. The mask image will be inverted and the euclidean distance map (edm) is applied. The edm is created with a 16-bit output image so that distances longer than 255 can be measured.
The mean pH-value for all pixels with the same distance from the selection is calculated and a plot is created from these values.
Results
| Input Image | pH-Image | Selection | Plot |
 |
 |
 |
 |