Measure Rosette Area Tool
The Measure Rosette Area Tool allows to measure the area of the rosettes of arabidopsis plants in images like this one: example image.
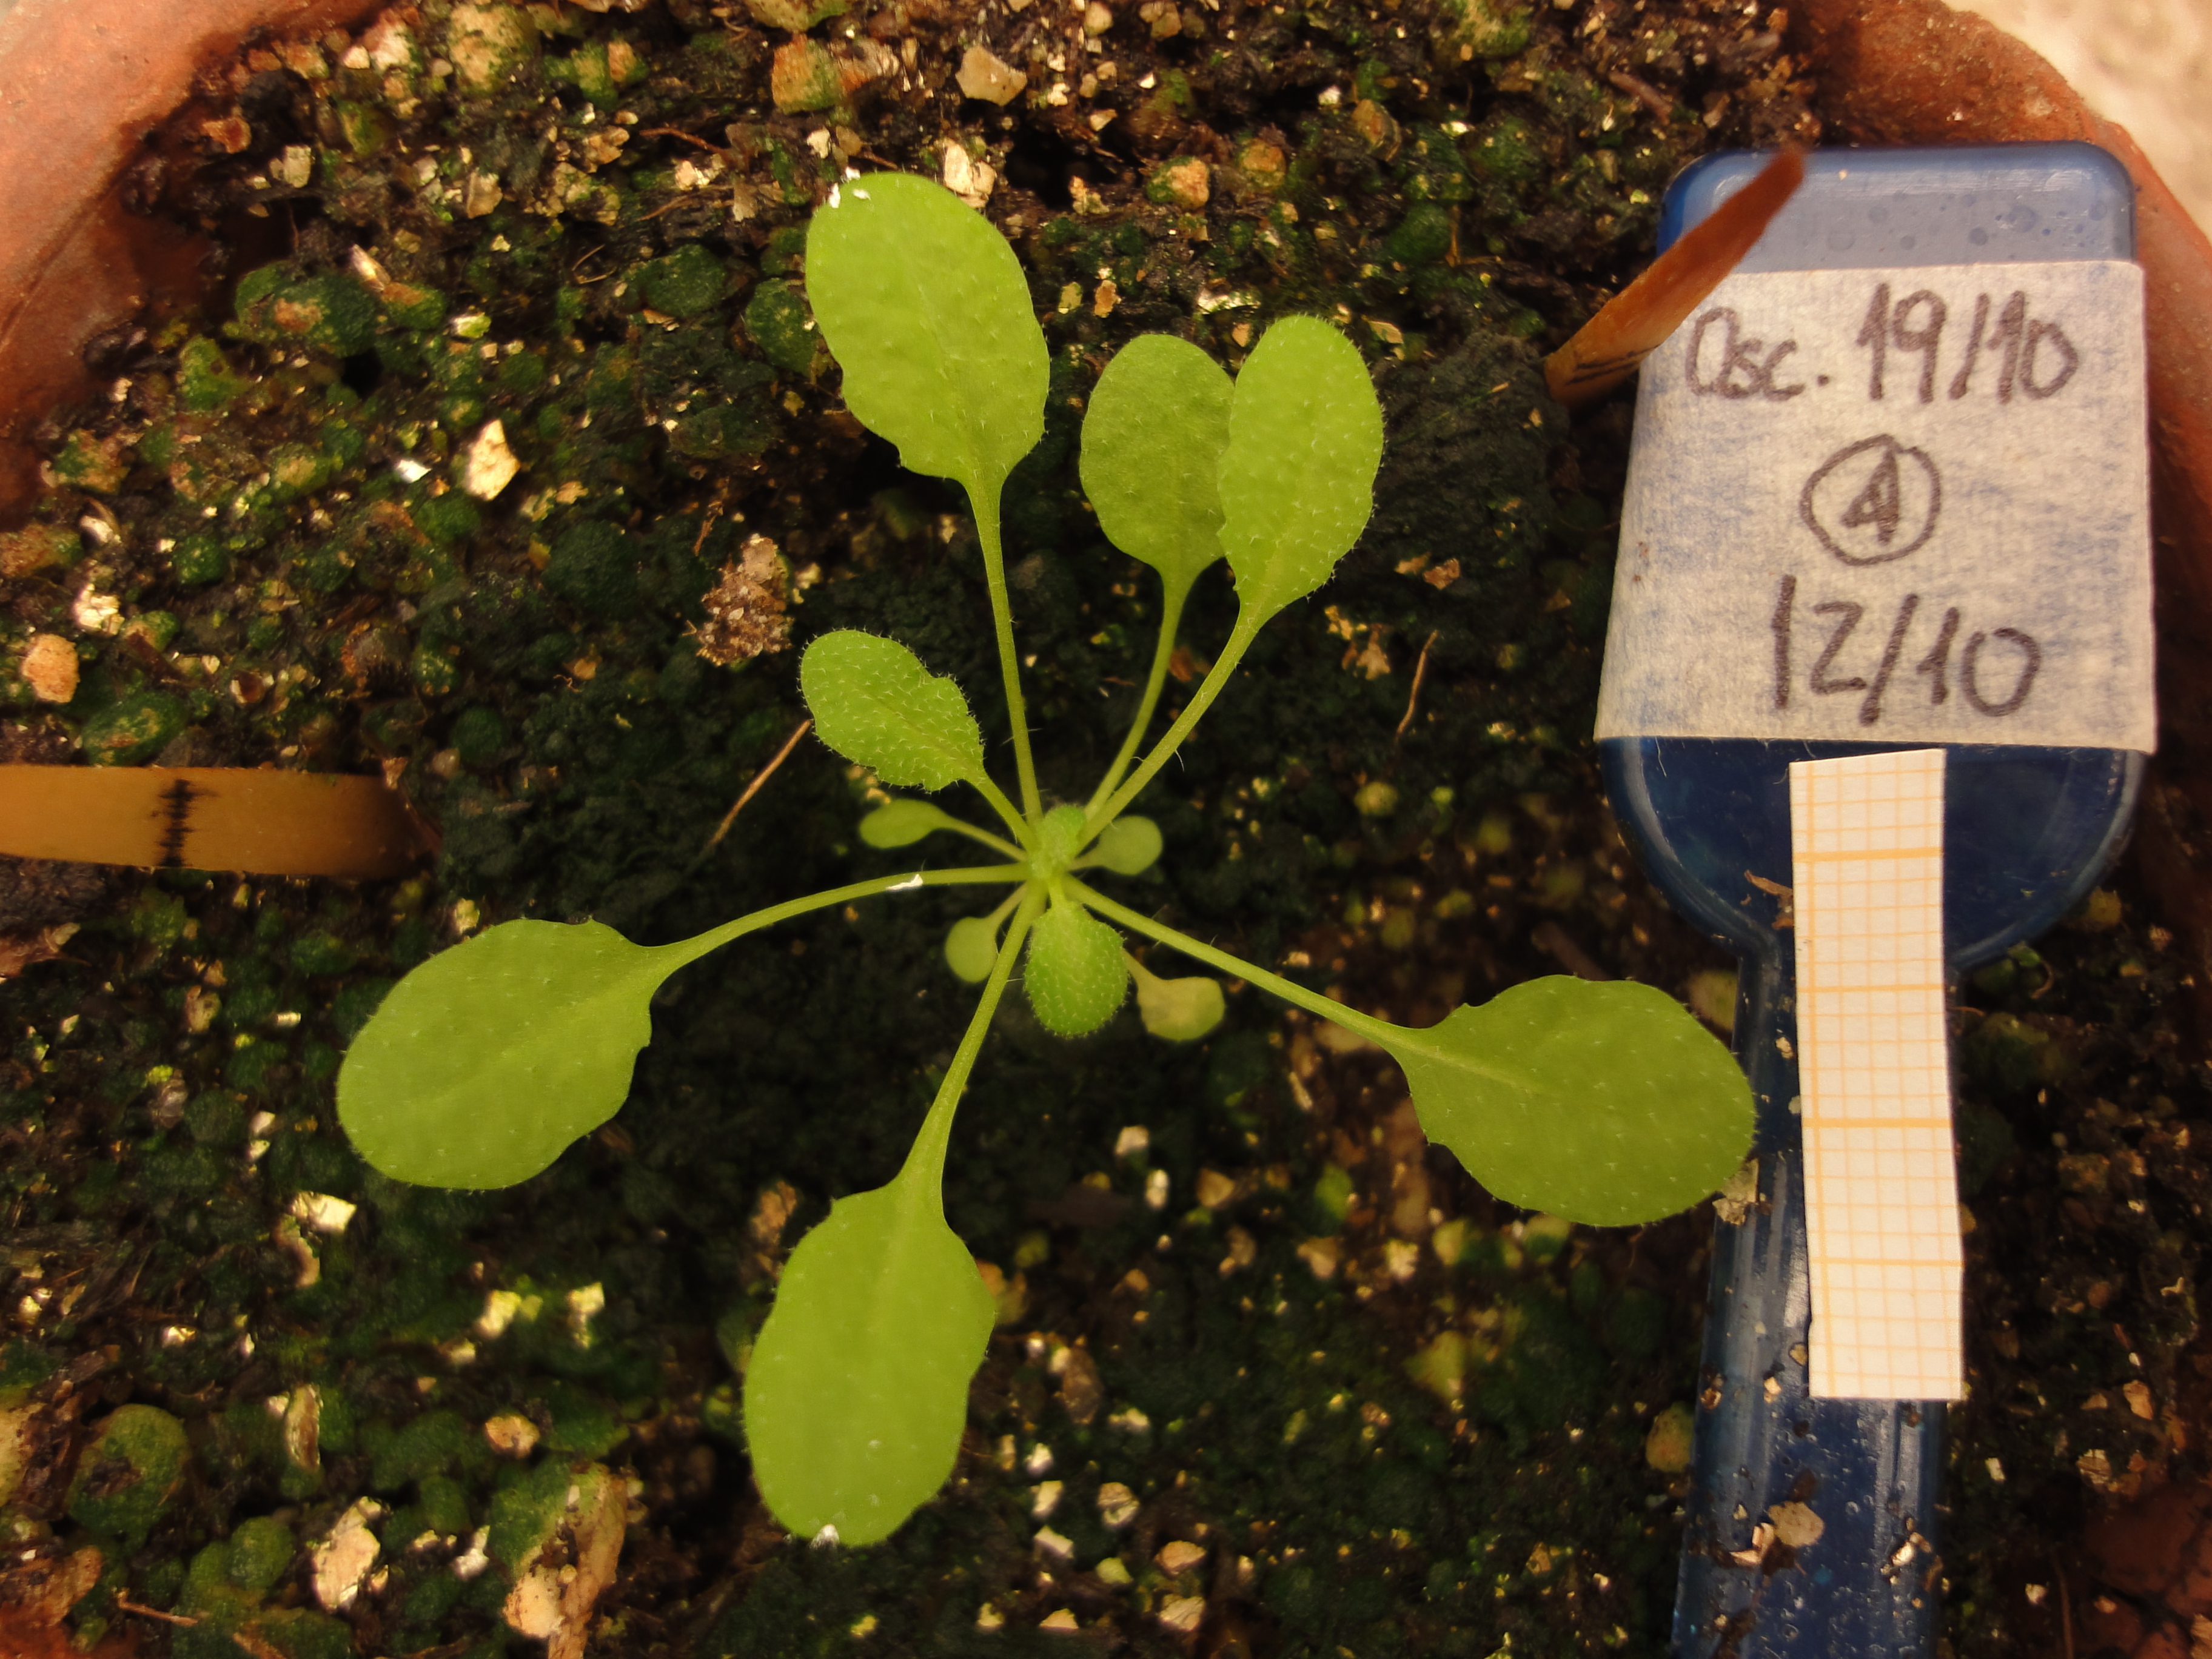
License: CeCILL-C
Getting started
Install the "Macro_IO_Settings plugin". Download the file iosettings.zip and unzip the archive file in the plugins folder of your ImageJ installation. Drag the link measure_rosette_area.ijm to the ImageJ launcher window, save it under macros/toolsets in the ImageJ installation and restart ImageJ.
Select the "measure_rosette_area" toolset from the >> button of the ImageJ launcher.

- the first button (the one with the image) opens this help page
- the m-button measures the area of the rosette in the current image
- the b-button measures a number of arabidopsis images in batch-mode.
Manual measurement
Open an image of an arabidposis plant. Press the m-button and wait a moment. The rosette will be selected in the current image and the name of the image and the measured area are written to the results-table.
 |
 |
Note that the measured area is in pixel unless the input image had a spacial-scale defined (Analyze>Set Scale).
Method
The macro uses a color threshold in the lab-color space. The corresponding part has been created with ImageJ's color thresholder (written by Gabriel Landini). After the color-thresholding the particle analyzer is used to exclude objects smaller than a given minimum size.
Options
A right-click on the m-button opens the options dialog. The options are shared by the manual and the batch tool.

- min. luminosity the minimum threshold value in the luminosity channel L*.
- max. luminosity: the maximum threshold value in the luminosity channel L*.
- min. green-red the minimum threshold value in the green-red channel a*.
- max. green-red the maximum threshold value in the green-red channel a*.
- min. blue-yellow: the minimum threshold value in the blue-yellow channel b*.
- max. blue-yellow: the maximum threshold value in the blue-yellow channel b*.
- min. size: the minimum size of the rosette
Pixels with smaller values than the min. values in one of the channels will be excluded from the result. The same applies for pixels with bigger values than the max. values in one of the channels.
Batch measurements
Press the b-button of the toolset. Two dialog-windows will be opened. Press the add... button on the IO-Settings dialog.
 |
 |
This will open a file-dialog. Browse to the input files and select them. Note that you might have to change the file-type-filter to "all images" in order to see your files. You should now see the files in a list-editor window. You can use it to add further files from other places or to remove files from the list.

Once you have the files you want in the list, press the close button and then press the ok button of the Action-Required dialog. The processing will now be started and the progress will be indicated in the log-window.

Once the processing finished a spreadsheet file Results.xls is written into the folder that contains the first input image. Results.xls contains the area measurements of the rosettes. It is a text file containing tab-separated values.

Note that the area-measurements will be in pixel unless you set the scale of the image. This can be done in ImageJ from the menu Anazlyze>Set Scale. If a scale is set the measurements will be in the unit of the scale (for example cm or mm).
In each folder containing input images a subfolder control is created. It contains images of the rosettes that have been taken into account for the measurement.

Publications citing the tool
- Liu, S., Yu, F., Hu, Q., Wang, T., Yu, L., Du, S., Yu, W., and Li, N. (2018). Development of in Planta Chemical Cross-Linking-Based Quantitative Interactomics in Arabidopsis. Journal of Proteome Research 17, 3195–3213.
- - Grunden, Amy Michele, Sederoff, Heike, Smith, Caroline Michael, and Aslett, Lola Denise (2018). METHODS AND COMPOSITIONS FOR ENHANCED BIOMASS PRODUCTION AND INCREASED ABIOTIC STRESS TOLERANCE., United States Patent Application 20180168120, NORTH CAROLINA STATE UNIVERSITY
- - René Boesten (2015). Functional analysis of two photosynthesis related genes (ASN2 and PAH2) in the response to high light. WAGENINGEN UNIVERSITY.