MS2Quant Pre-Processing
This toolset allows to optimize the workflow for the pre-processing needed to work with the program MS2Quant. The steps of the workflow are:
- Concatenate two stacks for all images in a folder. The filename of the first stack must have the form
<name>_PST_<a><b>1_pt_<c>.dv
The filename of the second stack must than have the form
<name>_PST_<a><b>2_pt_<c>.dv - Use the Crop_4D_Cells toolset do define background regions.
- Run the "measure background" task which will create a spreadsheet file with the mean background values for each stack
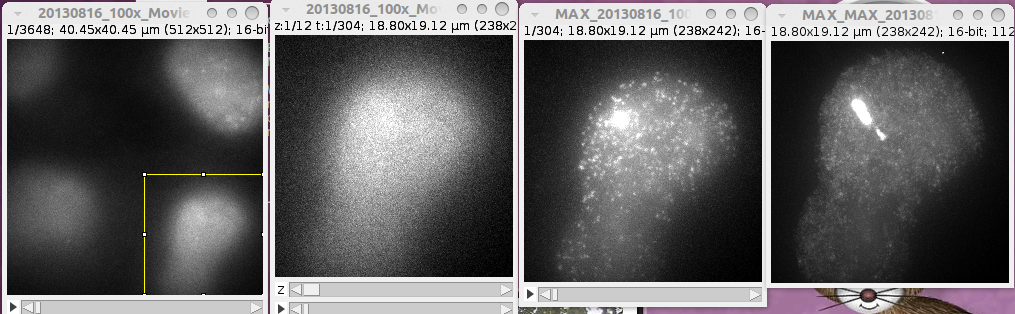
- For each stack select and crop one cell after the other. Two projections are displayed
- Use the projections to select the transcription-site (T), the nucleus (N) and a control region in the nucleus (C). They will be added to the roi-manager automatically and named in dependence of the order. They will be saved automatically.
An example dataset can be found here (3.9Gb).
Getting started
To install the tool, drag the link MS2Quant_PP.txt to the ImageJ launcher window and save it under macros/toolsets in the ImageJ installation. Select the "MS2Quant_PP" toolset from the >> button of the ImageJ launcher.

- The first button (MS2) opens this help page. A right-click on this button allows to adjust the parameters of the tool.
- The cs-button runs the concatenate stacks batch.
- The mb-button runs the measure background batch.
- The crop-button crops the selected cell and displays the projections. The cropped cell is saved into a folder.
- The +roi-button allows to add the selections for the transcription site, the nucleus and the control region.
- The rois-button allows to add the selections for the transcription site, the nucleus and the control region for batch processing.
- The save-button saves the projection image and the rois for the batch-processing.
Options
Open the options dialog by right-clicking on the ms2 button.
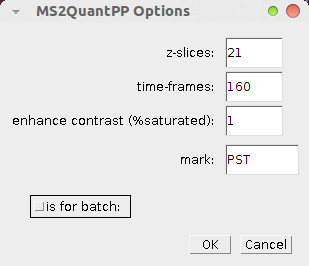
- z-slices: the number of z-slices in the stack
- time-frames: the number of time frames in the stack
- enhance contrast (%saturated): when the projections are displayed, the display-contrast is automatically enhanced. This parameter fixes the number of pixels that are allowed
to become saturated in the contrast enhancement. - mark: a mark that allows to parse the filenames (the mark is "PST" in the example images).
- is for batch: if selected the pre processing is done for MS2Quant batch processing, otherwise for manual processing
Usage
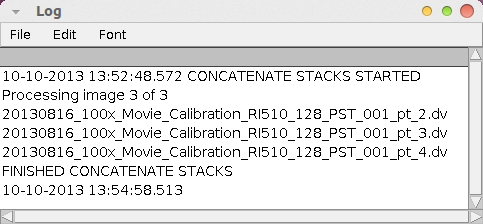
For a new experiment first set the number of z-sclices and time-frames in the options dialog. Run the concatenate stacks batch by clicking on the cs-button. The process is displayed in a log-window:
The next step is to use the Crop_4D_Cells toolset do define background regions. Note that only one region (the first) for each image will be taken into account. Also note that you should not use the E-button (export cells) on this toolset.
When this is finished, switch back to the "MS2Quant_PP" toolset. Open the first image and select a cell. Press the crop-button. The cropped image of the cell will be saved and the projections will be displayed.
Select the transcription-site and press the +roi-button. A roi with the label "T" is added to the roi-manager. Than select the nucleus and press the +roi-button again. This time a roi with the label "N" is added. Finally select a control region within the nucleus and add it in the same way. Its label will be "C". Note that you can use any projection to create the rois. You can transfer them between the images using Edit>Selection>Restore Selection (ctrl+shift+e). The cell window and the projection windows will be closed. You can now repeat the procedure for the next cell. When all cells in the image have been treated, continue with the next image. For each cell a folder with the name of the input image followed by _cn, where n is the number of the cell, will be created. It will contain the cropped cell and the selections T, N and C in the file RoiSet.zip.
If you select is for batch, you must use the rois button to add the transcription-site, the nucleus and a control region. In this case you repeat the selection for all cells in the same images. The selections will be numbered. When finished press the save button.