Leaf Infection Tools
The Leaf Infection Tools allow to measure the area of leaves, of two stainings in different channels and of the overlap region of the two stainings.
License: CeCILL-C
Getting started
To install the tools, drag the link MRI_Leaf_Infection_Tools.txt to the ImageJ launcher window, save it under macros/toolsets in the ImageJ installation and restart ImageJ.
In order to be able to calculate the correlation, you need to download the gdsc plugins from the website of the University of Sussex and the file CorrelationCalculator.jar. Put the two files into the plugin folder of your ImageJ.
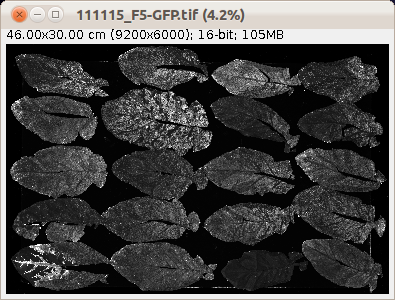
You can find an example image for the gfp-channel here. And an example image for the RFP-channel here.
Select the "MRI_Leaf_Infection_Tools" toolset from the >> button of the ImageJ launcher.

- the first button (the one with the image) opens this help page
- the a button applies a gray-scale lookup-table and adjusts the display-contrast of the image
- the m button runs the analysis of the leaves according to the selections in the roi-manager
Options
Open the options-dialog by right-clicking on the m-button.

- green channel is the name of the channel of the first staining. The name must be part of the filename of the first input image.
- red channel is the name of the channel of the second staining. The name must be part of the filename of the second input image.
- thresholding method the histogram based thresholding-method used to separate the signal in the two channels from the background
- calculate correlation - if selected the Pearson's coefficient if calculated
- count areas - if selected the separate green and red areas are counted
- min. size - areas with a smaller size (in pixel) are excluded from the count
Analyze Leaf Infections
Open the two images containing the two channels. You can adjust the display with the a button. In the green-channel make a rectangular selection around the first leaf. Add this selection to the roi-manager (by pressing the t key). Call the duplicate command on the selection (shift+d). In the small image, use the threshold-adjuster (shift-t) and the magic-wand tool to select the leaf. You can correct the selection using the freehand-selection tool. With the shift-key down you can add to a selection, with the alt-key down you can subtract from a selection. Add the selection of the leaf to the roi-manager (press t). Close the image of the leaf.
Repeat the above for all leaves in the image that you want to analyze.
Then make sure that the gfp-image is active and that the results-table of ImageJ is closed or empty. To start the calculation press the m-button.
Results
These are the example input images after the display has been adjusted using the a-button:  |
 |
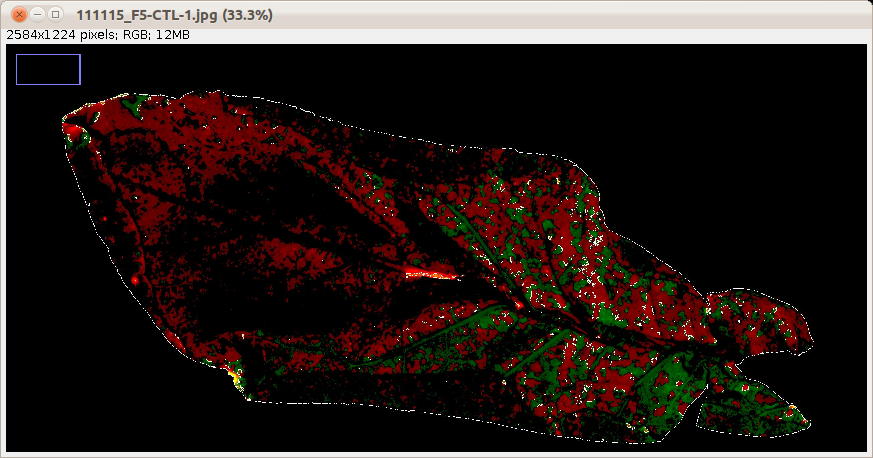
The results-table contains the measurements of the area and perimeter of the leaf, the green signal, the red signal and the overlap of the green and red signal and the Pearson's coefficient as a measure for correlation between the green and red signal.

For each leaf a control image is saved into the subfolder control of the folder that contains the input image. It contains the red signal taken into account for the area and perimeter measurement, the green signal taken into account, the outline of the cell and the outlines of the overlap regions. Furthermore one image showing the outlines of the areas counted is saved for each channel.

Publications using the tools
- Gutiérrez, S., Pirolles, E., Yvon, M., Baecker, V., Michalakis, Y., and Blanc, S. (2015). The Multiplicity of Cellular Infection Changes Depending on the Route of Cell Infection in a Plant Virus. Journal of Virology 89, 9665–9675.