Artemia Tools
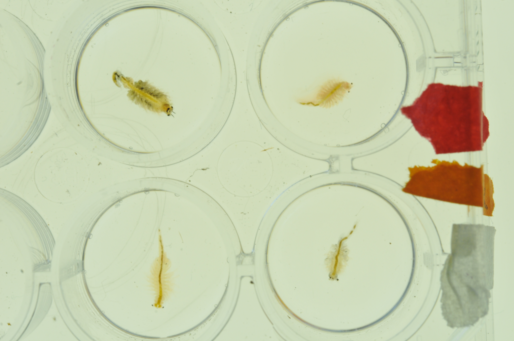
The Artemia Tools help to calculate the normalized redness of Artemia in images like these: artemia1, artemia2 and artemia3.
License: CeCILL-C
Getting started
To install the tools, drag the link MRI Artemia Tools.txt to the ImageJ launcher window, save it under macros/toolsets in the ImageJ installation and restart ImageJ.
Select the "MRI Artemia Tools" toolset from the >> button of the ImageJ launcher.
- the first button openes this help page
- the p-button prepares the image by creating an rgb-stack
- the m-button measures one specimen in the image
- the n-button opens the next image in the folder
- the c-button asks for the red-reference region and calculates the corrected redness of the specimen measured before
Instructions
- Use File>Open to open the first image you want to analyze in the folder with your input images.
- Press the p-button. This transforms the opened image into an RGB-stack and opens the threshold adjuster.
- Select the first specimen - you can do this by adjusting the upper-threshold value in the threshold tool (best seems to be to select Over/Under display mode) and then when everything around the specimen is green, click on the specimen with the magic wand tool from the ImageJ launcher window.
- Add the specimen-selection to the roi-manager by pressing 't' (the roi-manager will be opened if necessary).
- Select the part to be subtracted from the selection. First use control+shift+a to delete all rois from the image, then adjust the lower threshold and use the magic wand tool or make a manual selection using the freehand-selection or another selection tool. Zoom into the image to make a good selection. The selection can consist of multiple parts, in this case hold down shift when adding parts to the selection. Hold down alt to delete parts of a selection.
- Add the selection to be subtratced to the roi-manager by pressing 't'.
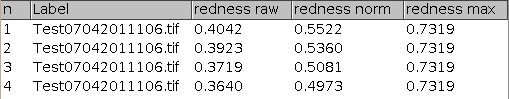
- Press the m-button on the toolset to measure the intensities in the three channels. This will open the results table and add the measurements to it.
- Go to the next specimen in the image (you can drag the image by holding down space-bar, clicking into the image and moving the mouse.). Repeat the procedure from step 3.
- When all specimen of an image are measured, press the c-button to calculate the redness-values. Click the c-button. Select a region in the red-reference area and press the ok button of the "Action required" dialog. This will write the raw-redness the normalized redness and the mean-redness-value of the normalization area for the current image into a new results-table.
- Press the n-button to go to the next image and repeat the procedure starting at step 2
- When all images are measured transfer the results into a spreadsheet-application either by using copy and paste or by saving a file and using the file-import in the spreadsheet application.
 |
 |
Publications using the tool
- Rode NO, Lievens EJP, Flaven E, Segard A, Jabbour-Zahab R, Sanchez MI, et al.
Why join groups? Lessons from parasite-manipulated Artemia.
Ostfeld R, editor. Ecology Letters. 2013 Apr;16(4):493–501.